About the database
The Regional Heat Demand Database (RHDD) was developed by EECA and is an interactive data visualisation tool that enables users to view process heat fuel demand by region and sector. Users can access data across the entire country or focus in on regions and sectors of interest using an interactive map or bar chart visuals. The tool was updated in August 2024 to display data for all of New Zealand.
In 2022 burning fossil fuels to supply process heat made up about 20% of New Zealand’s overall energy-related emissions. Reducing these emissions is a key opportunity for New Zealand, and having a better understanding at a regional level is an important step in enabling this.
Some of these emissions can be reduced by redesigning the underlying processes, but decarbonising the remaining heat needs will require switching from fossil fuels to low-emission fuels, such as wood fuels in boilers, or electricity in electric boilers or heat pumps.
These changes will have implications. Switching to electricity will increase loads on electricity networks, at both the distribution and transmission levels, and may require investments to increase capacity. The cost of switching to wood fuels will depend on fuel availability, which varies regionally, and on the amount of competition for the resource.
The RHDD records both where existing process heat demands are, and information about the demand such as sector, region, and current fuel source. This database is the most comprehensive and holistic assessment of heat demand across New Zealand and will inform and enable decisions to be made to change course to support fuel switching and decarbonisation.
Insights summary from the latest data
The database shows 713 sites with a total process heat energy consumption of 28,141/pa GWh. This is approximately 70% of the estimated total process heat energy consumption for businesses in New Zealand.
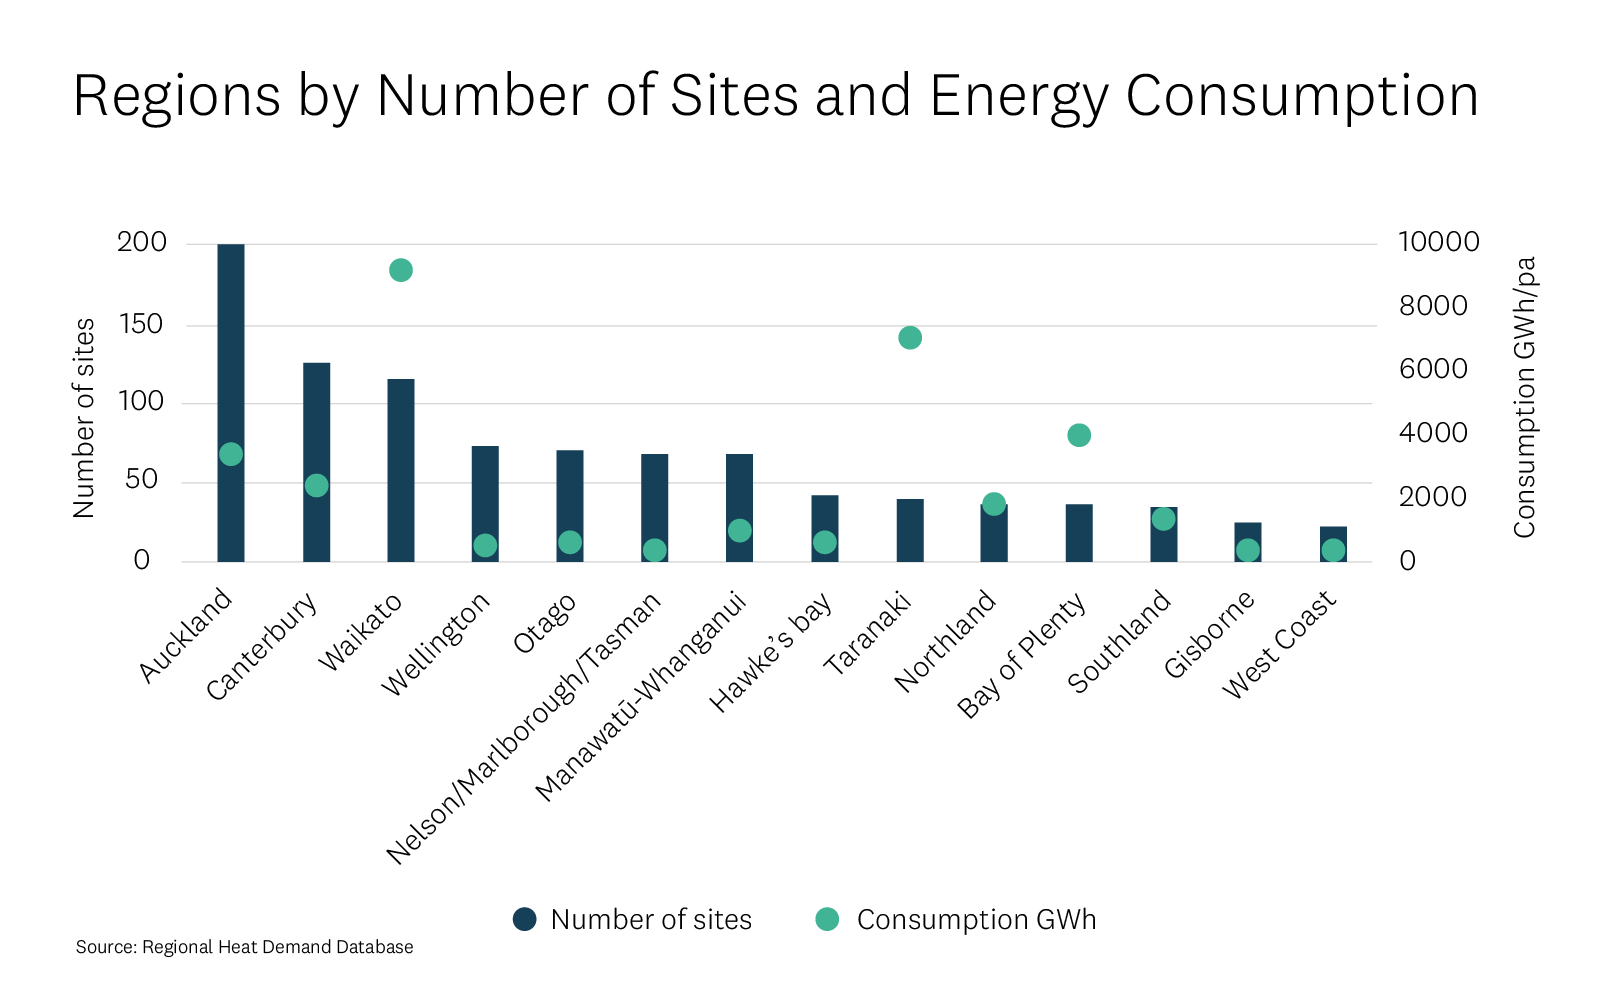
Site and energy consumption – regions
Auckland has the most sites with 191, mostly in the food and beverage sector, and Government / education sectors. Waikato has the largest energy consumption of 8528GWh per year mainly in the wood product manufacturing industry, made up of 64% by-products such as black liquor, and 34% piped fossil gas. Taranaki also has large energy consumption of 7104GWh/pa, mostly within the oil and gas industry.
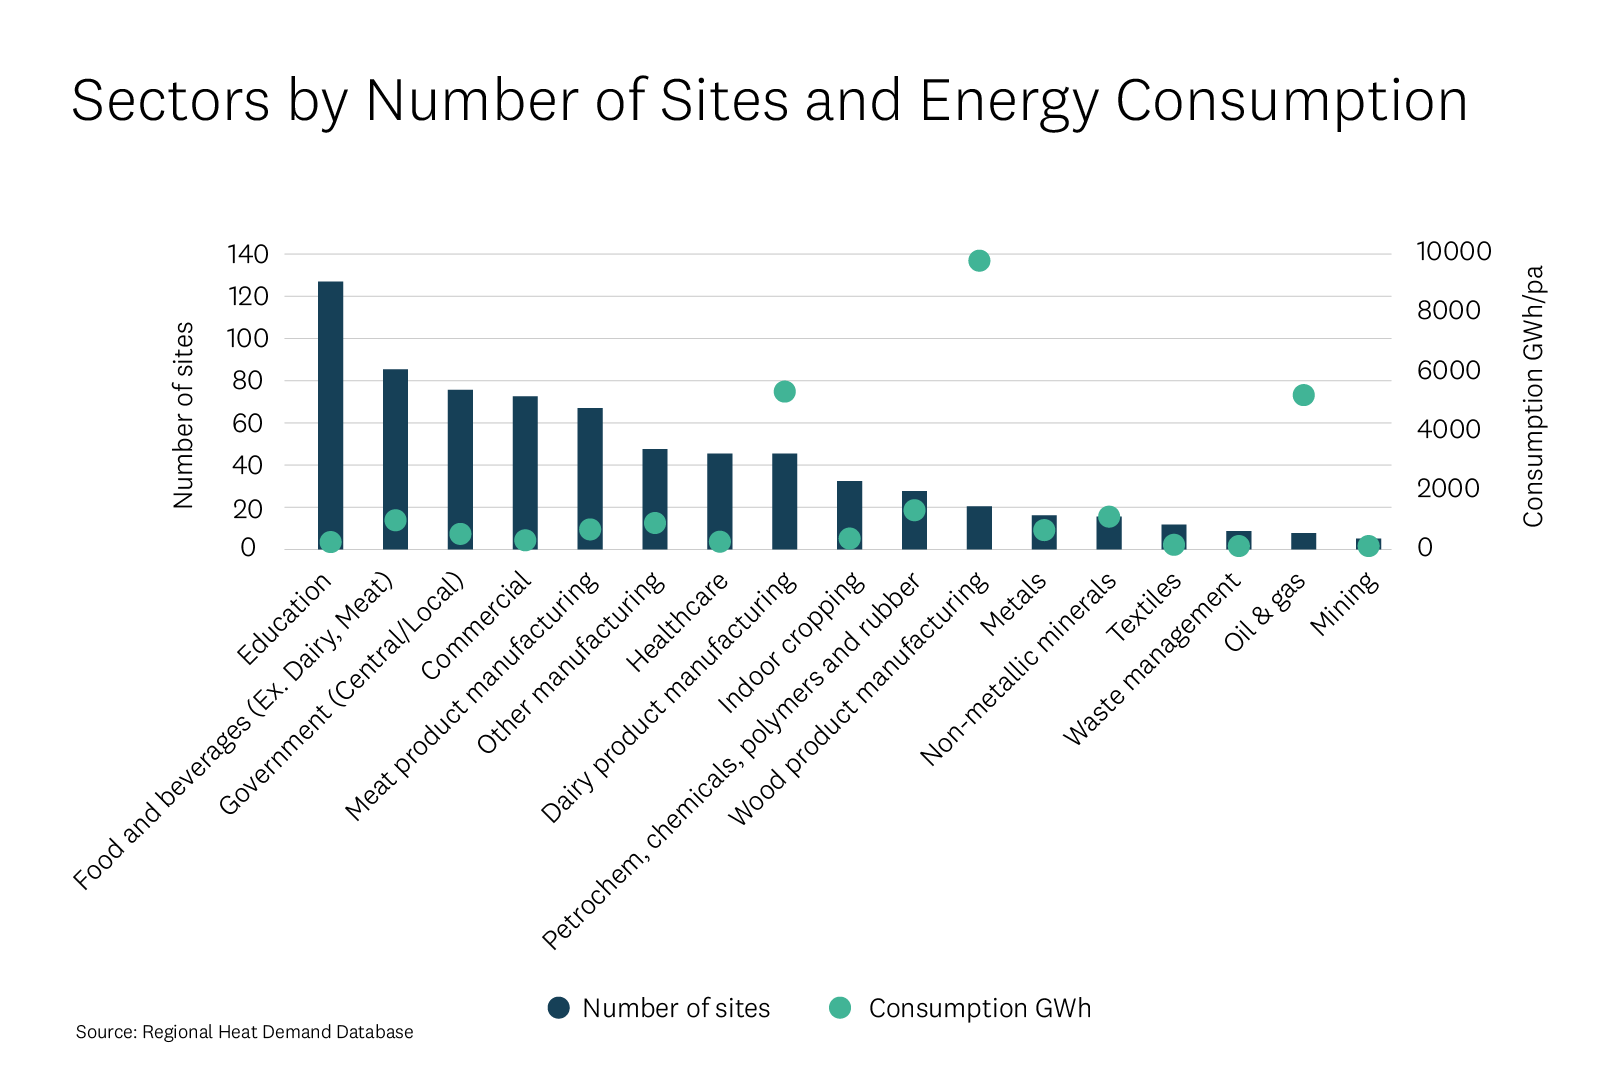
Site and energy consumption - sectors
Education (schools, tertiary institutes) has 128 sites in the database although the sector’s energy consumption is very low compared to wood products, oil and gas and dairy product manufacturing. Each region has its own unique sector profile. Auckland and Wellington are heavily commercial, the South Island is primarily meat and dairy, and Hawkes Bay has a lot of food product manufacturing sites.
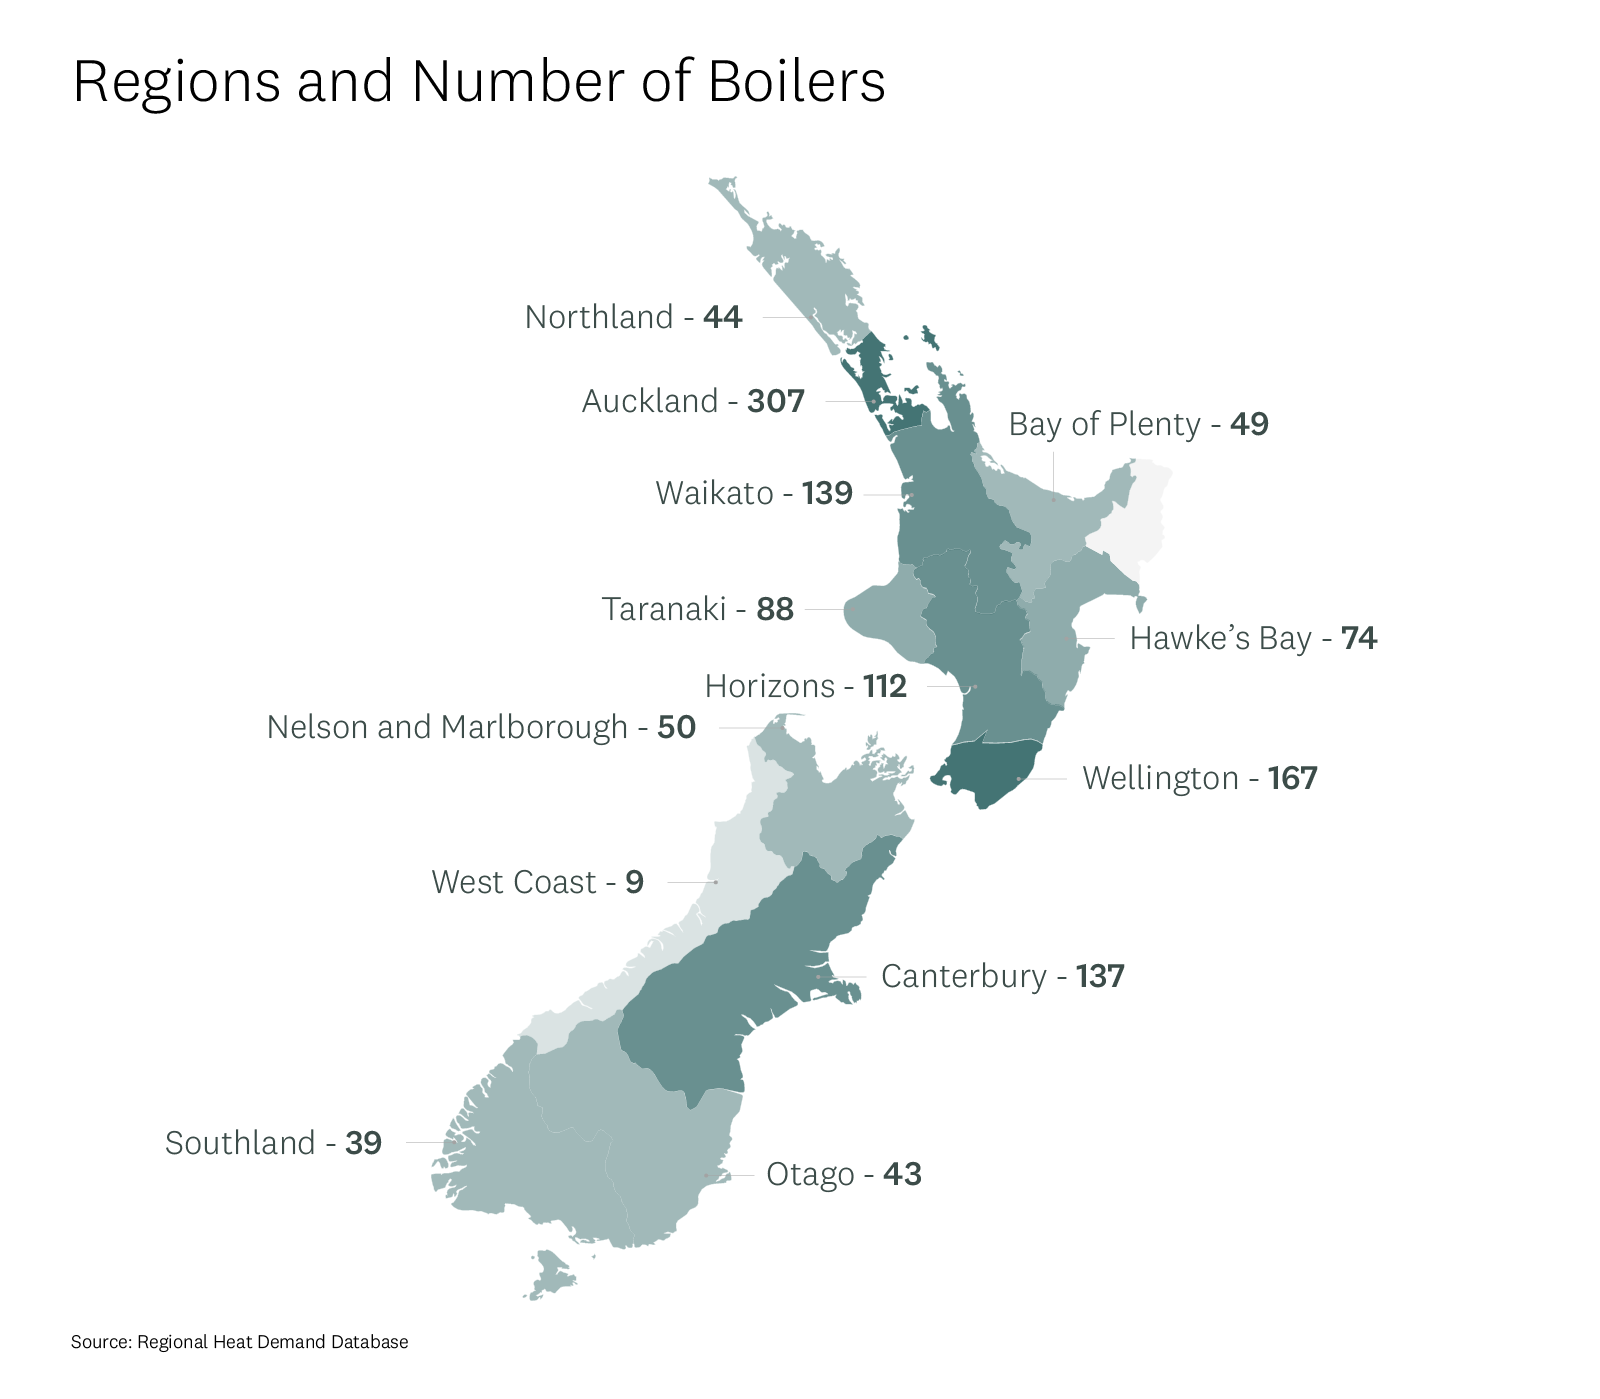
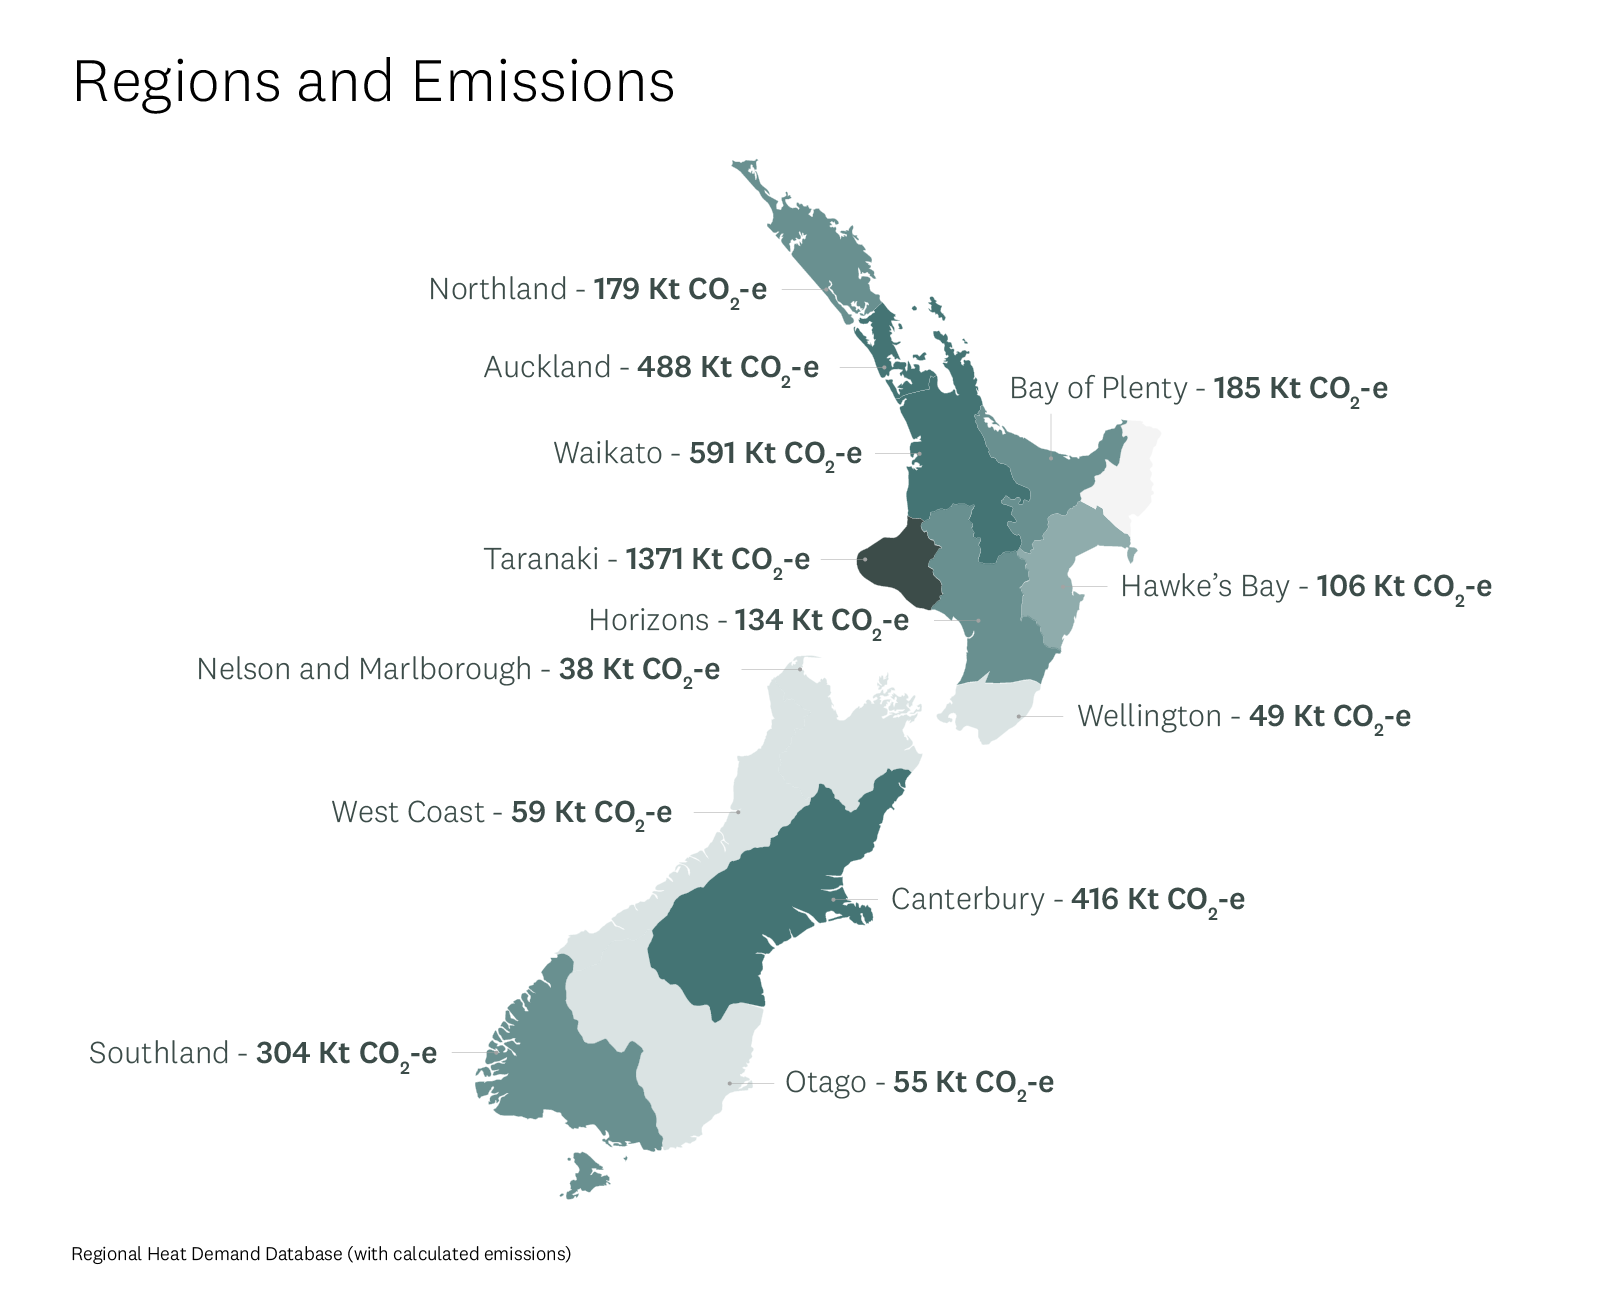
Boilers and emissions
The maps below show the distribution of boiler numbers by region and emissions by region– dark regions have higher boiler counts and emission volumes. A map of different countries/regions with white text.
Fuels
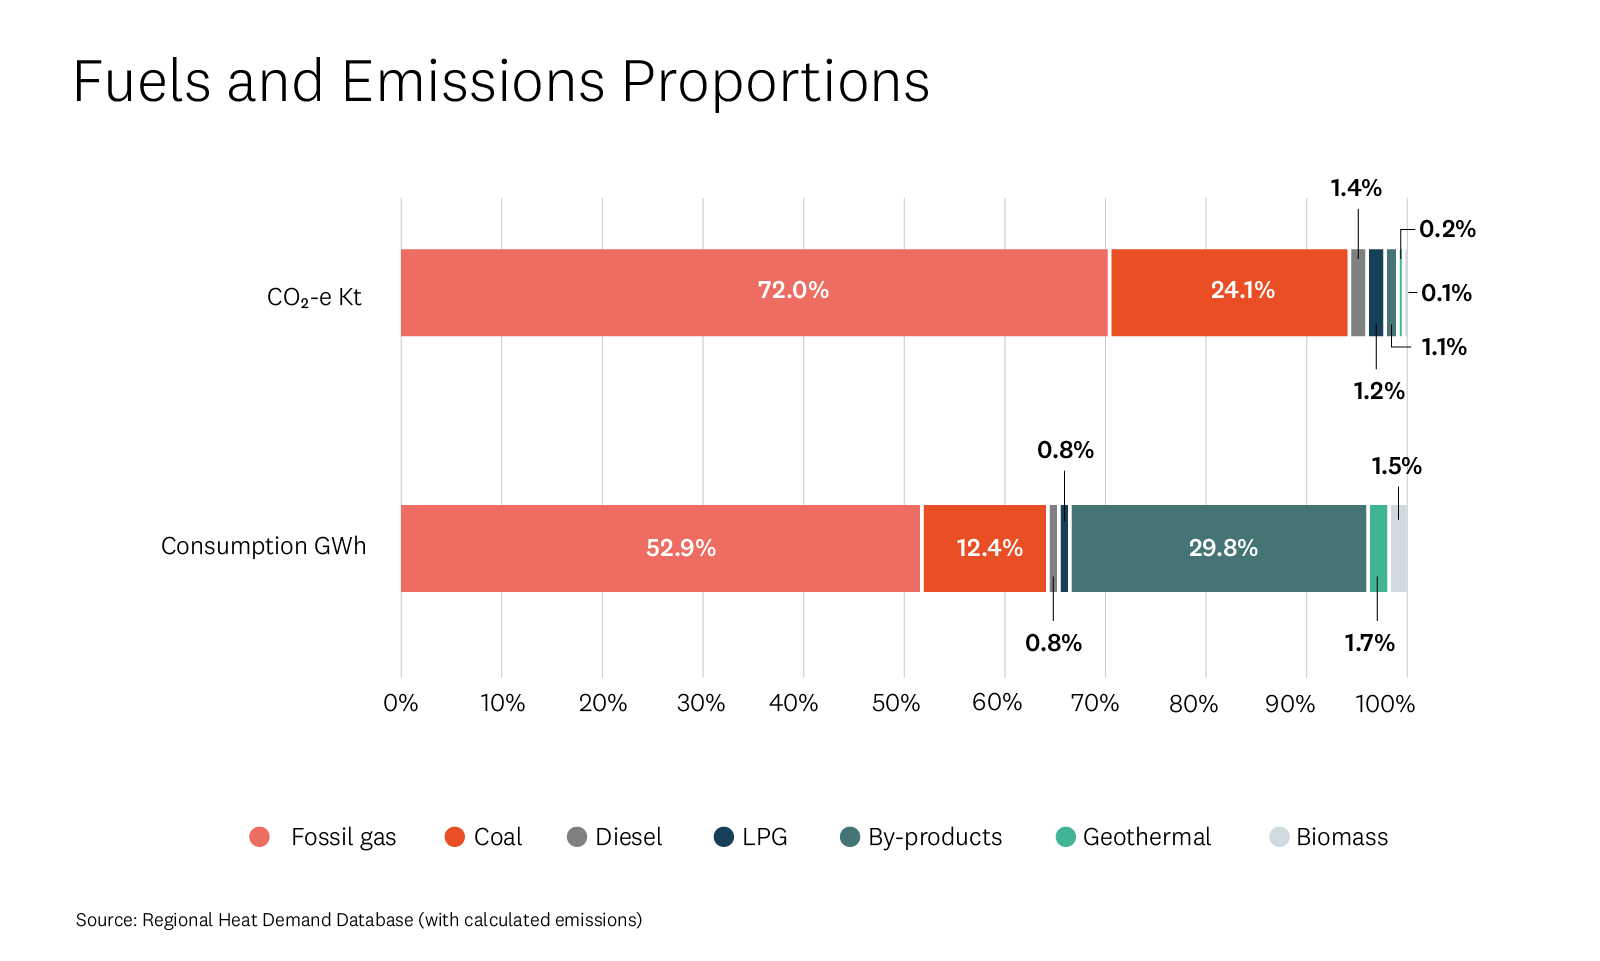
The database shows 52.9% of all fuel is fossil gas (exclusively across the North Island) which accounts for 72% of all emissions. Coal (mainly in the South Island) makes up 12.4% of energy consumption and accounts for 24.1% of all the emissions. All the other fuels observed are small, except for by-products, which is mostly black liquor in the wood product manufacturing sector. This accounts for only 1.1% of all associated emissions.
About the data
The data in the Regional Heat Demand Database includes an anonymised aggregated view of sites with a heating capacity above 500 kW that use fossil fuels as their primary fuel source for process heat. The data is aggregated but can be filtered by region and sector.
The information includes a summary of:
- Site counts by region and sector
- The type and amount of fuel or fuels used to supply the heat e.g. coal, diesel
- Annual energy consumption (GWh) and rated capacity (MW).
Keep up to date on new data releases through the EECA NEWSLETTER
How to use the database
The main page of the Regional Heat Demand Database is an interactive map of New Zealand with the ability to toggle on and off specific aspects such as site count, heat demand and average energy demand.
The selections in the region and sector drive what is shown in the map of New Zealand and in the corresponding charts on the right-hand side of the screen.
Each of the charts in the data visualisation tool are available for download as an image or as an open dataset and available to use under a creative commons license.